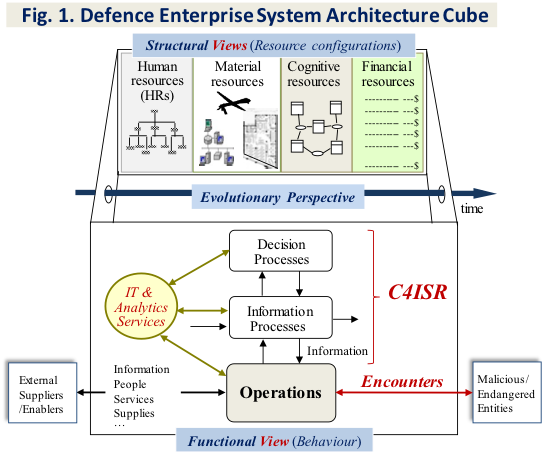
Strong, Secure, Engaged, the new Canadian defence policy, clearly specifies that the Canadian Armed Forces (CAF) are required to “achieve excellence” across a wide spectrum of military duties, from protecting Canada and North America, to engaging in peacekeeping, peacemaking, counter-terrorism, cyber, and humanitarian assistance operations, in an increasingly complex and unpredictable world. To achieve this mission, the CAF rely on carefully designed and continually improved Defence Enterprise Systems (DESs). DESs can be seen as capability-driven services and their generic architecture is illustrated in Fig. 1. Independently of a DES level or size, the human, material and information resources it embeds, the processes it performs and the IM/IT systems it exploits must be developed to achieve operational excellence on theaters of operation.
Unfortunately, the exact nature, timing and amplitude of future operations are not known with certainty. Threats and hazards that may distress DES assets are also difficult to anticipate. Moreover, as for any enterprise, available resources are never sufficient to develop flawless DESs that can always avoid or resist to malevolent attacks, accidental or natural perils, breakdowns, or Political, Economic, Social, Technological, Legal, and Ecological (PESTLE) unrests. The fact that imperfect DESs must deal with all sorts of unforeseen events is the source of mission failure risks. Developing a DES for mission assurance (MA) requires the addition of capabilities to minimize mission failure risks. When DESs are designed and developed to cope solely with expected events or requirements, as they often are, they are bound to stumble, and they cannot achieve excellence (i.e. sustained value delivery), as demanded in the defence policy. In what follows, we briefly show how analytics can be leveraged to help develop robust value-creating DESs.
Mission Failure Risk Sources
Some types of risks are very familiar to all of us, but others are more insidious. For example, aerospace engineers have been managing equipment failure risks for decades and the CAF are structured to do this efficiently. Accidents are also a familiar type of risk event. Although they are often covered by insurances, they can induce serious operational perturbations. The fire at the Gatineau Louis St. Laurent building in April 2016 which forced the move of 1,700 DND/CF employees is a good example. Natural hazards such as wildfires, floods, ice storms and epidemics can also disturb the CAF work.
This last case is more intricate because the CAF are both an instrument and a target. When confronted with a natural hazard harming Canadians, it is the responsibility of governments to warn, protect, rescue, help and inform Canadian victims. Such events are disastrous for Canadian citizens. When CAF support is requested, however, they lead to disaster relief operations that add value by providing safety and support to victims. On the other hand, if the DESs involved are themselves affected by the natural hazard, or if other disruptions (e.g. a communication breakdown) prevent helping victims adequately, this results in a benefit shortfall.
 In fact, most of the operations performed by the CAF have this characteristic. The CAF typically act in response to predicaments that could be directly or indirectly harmful to Canadians. It’s their mission. Contrarily to some government units that provide constant services to the population, CAF intervene in case of crises or conflicts. Since future crisis/conflicts are not completely predictable, the demand for CAF services is essentially random which is a significant risk. Planning capacity under uncertainty is a difficult task. One does its best to anticipate needs, but it is obvious that at various points in time operational surges that exceed planned capacity will occur. Adjustments must then be made by adding ad-hoc resources and/or limiting services, which impairs value delivery.
DES assets nowadays are also exposed to physical and/or cyber attacks from numerous threat agents, including terrorists, hacktivists, cybercriminals and malicious foreign nations, but as well privileged insiders. Among those, advanced persistent threats are particularly difficult to detect and stop. These targeted cyber attacks are performed by sophisticated adversaries with significant resources who engage in espionage to discover the defences in place and to detect vulnerabilities. They act repeatedly and adapt dynamically to defender’s efforts to resist. Their attacks are usually distributed, and they may involve diversions and camouflage.
Mission failure risks are not all linked to external phenomena or adversaries. Some risks are rather related to a deficient state of the DES, that is to incapacities originating from a failed design, construction errors, implementation flaws, partner shortcomings and/or operational weaknesses, all symptoms of lacking governance. Incapacities are usually latent or hidden until some events to which the DES should be able to respond makes them emerge. The current problems with the Canadian government pay system is a good example of this type of mission failure.
To sum up, mission failure risk sources can be classified in four broad categories: operational surges, hazards, threats and incapacities. Each of them gives rise to different types of incidents (unexpected events that require reactive actions) that, when the DES is not adequately prepared and protected, can lead to disruptions with significant consequences. Disruptions are incidents that cannot be treated sufficiently quickly and efficiently to avoid subsequent damages.
The Anatomy of Disruptive Processes
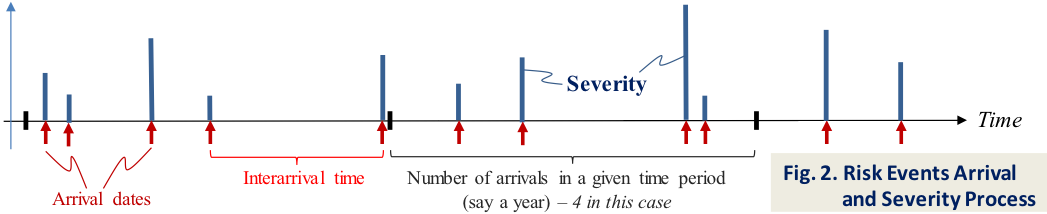
Analytics can be leveraged to study the behaviour of plausible incidents and disruptions, and to derive risk exposure measures. The way risk events materialize in time is illustrated in Fig. 2. Arrows are used to indicate event arrival dates (say cybersecurity breaches). The height of the vertical line associated to arrows reflects the severity of the disruption in an appropriate metric. Depending on the context, the metric used could be capacity lost (downtime), the number of work-hours needed to solve the problem, the time to recovery, the number of exposed records, etc. These severity variables can then be exploited to compute the magnitude of ensuing cost-benefit loss.
Analytics can also help classify recurrent risk events into incident types useful for control and decision making. Behavioural data can be accumulated on the location, timing, and severity of the incident types identified and used to estimate:
- The probability distribution of interarrival times
- The distribution of the number of incidents (or disruptions) during a time period (frequency)
- The distribution of the severity of disruptions
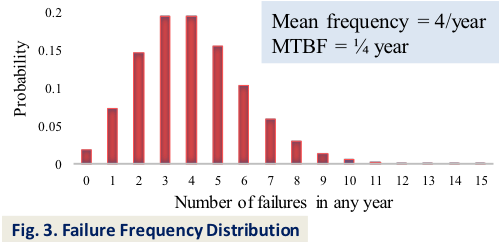
An example of a failure frequency distribution for a computer network is displayed in Fig. 3. The probability function shown is known as the Poisson distribution. It has been verified that this distribution is a valid model of risk event arrivals in many contexts such as service queues, equipment breakdowns, accidental and natural hazards, and nontargeted cybersecurity incidents. When evidence confirms that arrivals or severity follow a known probability distribution (like the Poisson), standard statistical techniques can be used to estimate its parameters (mean, variance…). Otherwise, an empirical distribution (a histogram plotted from available data) can be used.
For emerging incidents, or for very rare risk events, little data on their frequency and severity may be available. When this is the case, frequency and severity distributions can be estimated subjectively, for example by providing a mean value and a most likely inclusion interval. In project management, PERT distributions for activity durations have long been estimated this way. The FAIR (Factor Analysis of Information Risk) methodology supported by The Open Group also recommends this approach (see Technical Standard C13G, 2013).
But why is it important to estimate the probability distribution of disruption arrivals and severity? When these distributions are available, for a given DES design or a potential MA solution, standard simulation techniques (known as Monte Carlo methods) can be used to derive cost-benefit loss distributions for each solution considered. This is, in fact, the only reliable approach available to compare the value and risk of alternative designs or MA solutions. It has been shown that rating the risk of alternatives based on qualitative frequency-severity matrices, as is often done in practice, usually leads to poor decisions (see Cox Jr., What’s Wrong with Risk Matrices? Risk Analysis, 28-2, 2008).
The Effect of MA Capabilities on Disruptions
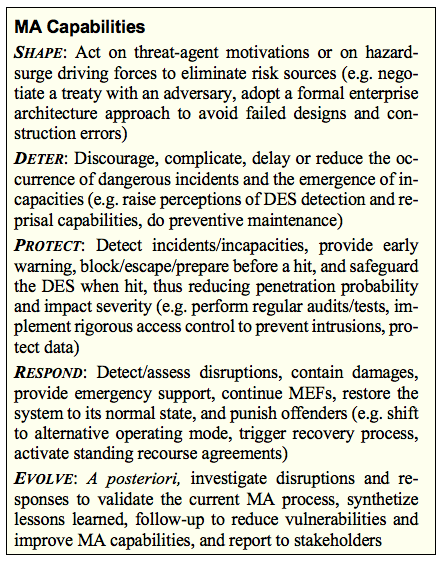
MA capabilities (often called risk controls) are implemented to favourably alter the behaviour of incidents and disruptions and to lessen their negative consequences. Several MA capability layers can be applied. The initial layers involve pre-emptive measures that act directly on mission failure risk sources either to eliminate the source altogether or to deter risk agents from acting. The following layers are defensive. Their aim is to prevent detected incidents from becoming harmful disruptions, for instance by the addition of DES asset protections. The final layers are curative. They ensure that mission essential functions (MEFs) can continue even if some assets are damaged and that harmed DESs can be returned to their normal state as quickly and efficiently as possible. The MA framework displayed in Fig. 4 illustrates how different MA capabilities are entangled with risk sources, incidents, disruptions and consequences.
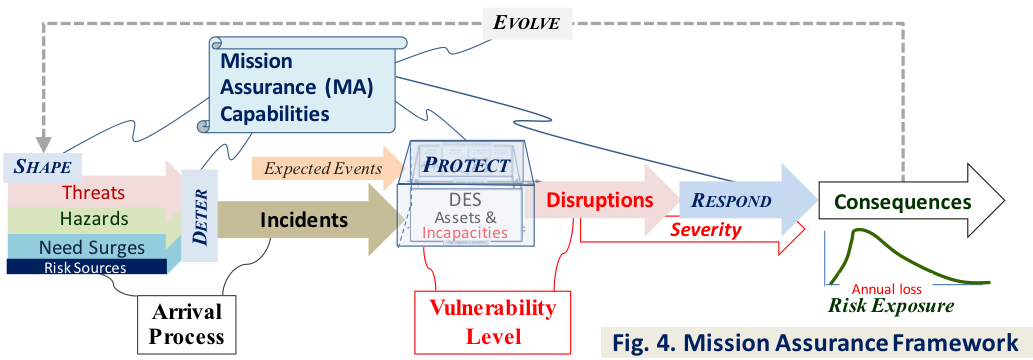
Shape and deter capabilities affect incident arrival processes. They reduce the frequency of incidents. Protections decrease the DES vulnerability level, that is the conditional probability that an incident/incapability becomes a loss disruption. Vulnerabilities are DES/MA flaws or weaknesses that could inhibit services or be exploited by threat-hazard agents. Protections may also reduce the severity of the impact when a penetration occurs. The overall consequences of a disruption depend on the DES response when hit.
 Consequences are measured in terms of cost-benefit loss. Relevant costs include containment, continuity and recovery activity costs, resource replacement costs, opportunity costs, penalty costs, and any loss induced by secondary effects. Benefit shortfalls are based on key performance indicators (KPIs) selected to reflect mission outcomes. With analytics, formal relationships can be established between impact severity measures and cost-benefit loss magnitude. These functions can be used, with the disruption frequency and severity distributions discussed previously, to simulate plausible future scenarios over a relevant planning horizon (say 3 years). The risk exposure distribution shown in Fig. 4 is derived by simulating a large sample of scenarios.
MA solutions profile incident and disruption patterns and consequently DESs risk exposure distributions. Hence, altering a DES design or MA solutions has a direct effect on the DES risk exposure.
Comparing Candidate MA Solutions
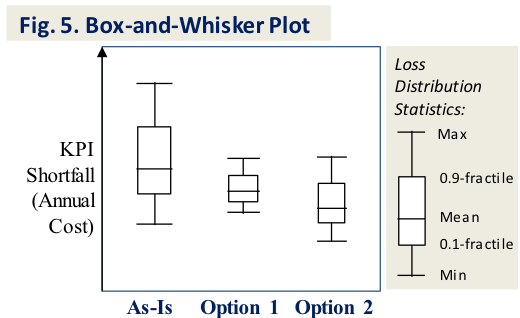
The development of a DES involves the comparison of alternative designs or candidate MA solutions. When any MA solution is changed, the DES risk exposure is also altered. Candidate solutions have, on one side, differing investment or leasing cashflows and, on the other side, differing value loss exposure distributions. One ends up comparing relatively predictable cashflows with probabilistic costs and benefit shortfalls. This is a complex problem to which analytics can contribute. Graphical decision aids can, for instance, be used to reveal fundamental tradeoffs. For example, the plot in Fig. 5 compares the risk exposure of an As-Is DES with its revised exposure under two MA solution modification options.
 A framework of the type presented here was elaborated by the Australian Armed Forces to analyze cyber capability options (see Rowe et al., Prioritizing investment in military cyber capability using risk analysis, JDMS, May 2017). The CAF could take advantage of the generic approach introduced in this text to enhance mission assurance in its DES development and improvement projects.
The views expressed in this text are those of the authors and not that of the CAF or the government of Canada.
Alain Martel is Professor Emeritus, Université Laval, Québec, Canada and Sophie Martel is a Master of Engineering, Canadian Forces’ Decoration (CD), Gatineau, Canada.